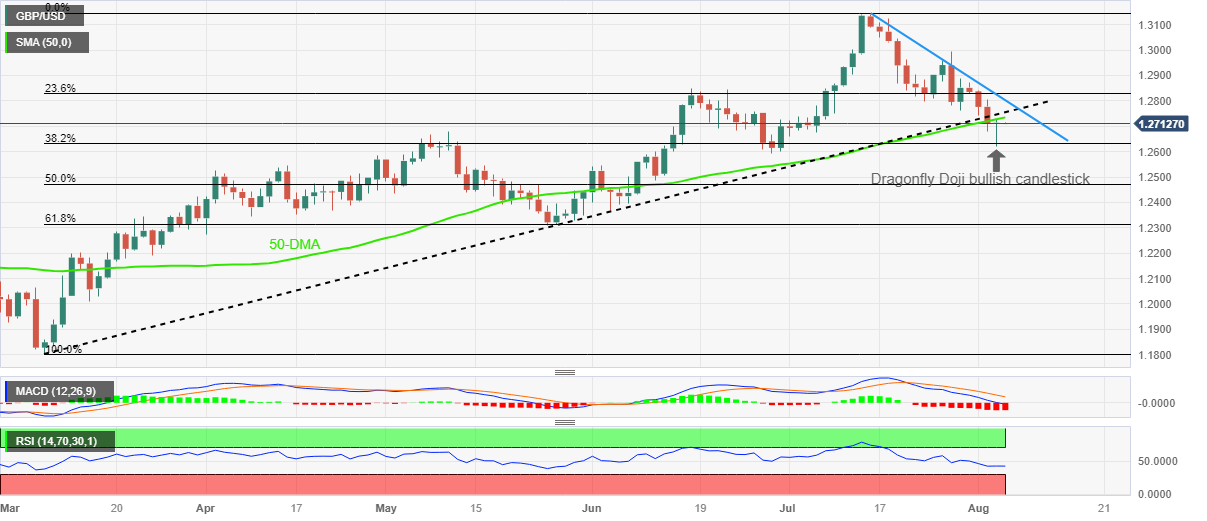
GBP/USD Price Analysis: Dragonfly Doji favors Cable to lick post-BoE wounds, focus on 1.2750 and US NFP
- GBP/USD stays defensive after bouncing off a five-week low.
- Dragonfly Doji bullish candlestick joins downbeat RSI to underpin minor recovery but Cable stays below key technical support-turned-resistance.
- BoE’s dovish hike, mostly upbeat US data and hopes of positive surprise from NFP favor Pound Sterling sellers.
- Further downside needs validation from late June swing low.
GBP/USD treads water around 1.2730 as it defends the previous day’s rebound from the lowest levels in five weeks but lacks upside momentum during early Friday morning in Asia. In doing so, the Cable pair struggles to justify the previous day’s Dragonfly Doji bullish candlestick, as well as the downbeat RSI (14) line, amid a cautious mood ahead of the US Nonfarm Payrolls (NFP).
The reason could be linked to the Bank of England’s (BoE) dovish hike joining the bearish MACD signals and the Pound Sterling’s sustained trading beneath the previously key technical support.
Also raed: GBP/USD recovers slightly after BoE’s rate hike, soft US economic data
Among them, the 50-DMA level of around 1.2735 gains the immediate attention of the GBP/USD buyers ahead of the five-month-old support-turned-resistance line around 1.2750.
Also challenging the short-term Cable upside is a downward-sloping resistance line from July 14, close to 1.2805 at the latest.
Meanwhile, the Pound Sterling’s pullback remains elusive unless it defies the bullish candlestick formation by slipping beneath the latest low of 1.2620. Even so, the late June bottom of around 1.2590 can act as an additional downside filter for the GBP/USD bears.
Overall, GBP/USD is likely to remain depressed despite the bullish candlestick and the pre-NFP consolidation.
GBP/USD: Daily chart

Trend: Further downside expected