NZD/USD Price Analysis: Pair reversed gains after touching 20-day SMA above 0.5890
- NZD/USD drops 0.10% on Tuesday, settling around 0.5880.
- Bulls failed to sustain the break above the crucial 20-day SMA, pushing NZD/USD back below it again.
- Indicators display mixed signals with hints of a bullish recovery.
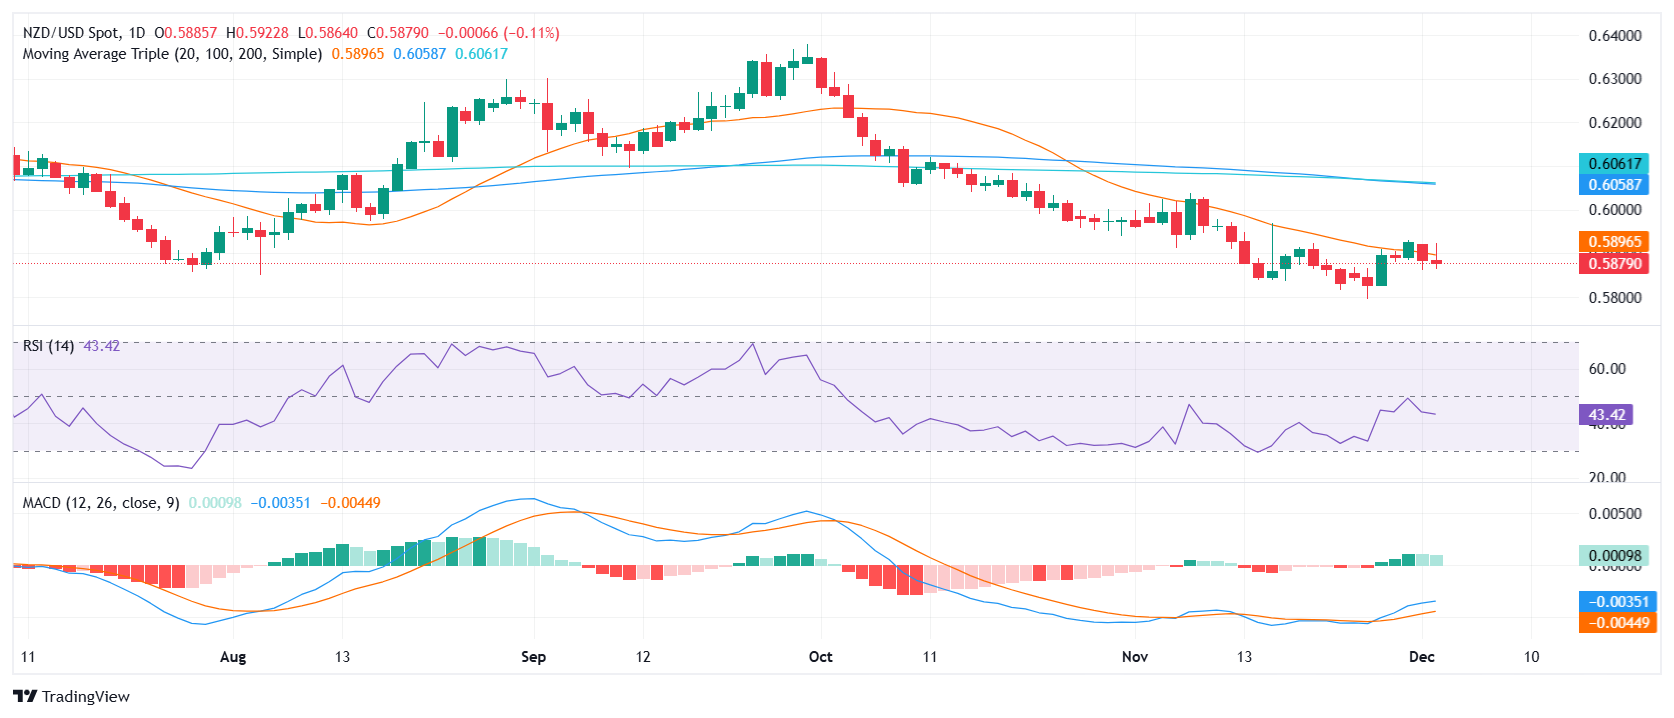
The NZD/USD pair retreated on Tuesday's session, giving up the initial gains after reaching a daily high of 0.5890, just above its 20-day Simple Moving Average (SMA). The pair fell back below this crucial short-term moving average and settled around 0.5880, down 0.10% on the day. /p>
Despite retreating from its intraday high and displaying a slight downward bias, technical indicators for NZD/USD there are some signs of bullish presence. The Relative Strength Index (RSI), which indicates buying and selling pressure, has begun to recover with a mildly increasing slope, suggesting that buying pressure is gaining ground. Conversely, the Moving Average Convergence Divergence (MACD), a momentum indicator, has a declining histogram with a greenish tint, indicating that buying pressure is gradually decreasing. This mixed signal suggests a potential shift in market sentiment towards the upside.
That being said, the trailing technical outlook remains bearish, with the pair needing to reclaim the 20-day SMA to shift the momentum in favor of the bulls. Until that happens any signs of a bullish recovery may be invalidated
NZD/USD daily chart
