NZD/USD Price Analysis: Kiwi trades weak, ahead of Q2 employment data
- NZD/USD fell near the 0.6150 area, losing more than 0.90%.
- New Zealand will release Employment Change, Participation and Unemployment rate data from Q2.
- Labour market outlook to determine following RBNZ decisions.
On Tuesday’s session, the NZD/USD fell sharply as markets await critical labour market data from New Zealand from Q2. As for now, the Reserve Bank of New Zealand (RBNZ) pointed out that they were done with tightening and hinted that they will hold rates at restrictive levels for some time.
As for now, markets are expecting the RBNZ to hold the Official Cash Rate (OCR) until May next year, but incoming data may determine the next decisions. Regarding employment, ANZ analysts expect to see a loosening in the sector and operating well beyond its “maximum sustainable level in the quarter”.
In terms of monetary policy, analysts believe that the data won’t suggest that the RBNZ’s job is done, but it will help to understand how the rates at 5.50% are affecting the labour markets.
That being said, the NZD traded with losses agains most of its rivals, including the AUD, JPY, USD, GBP, and EUR.
NZD/USD Levels to watch
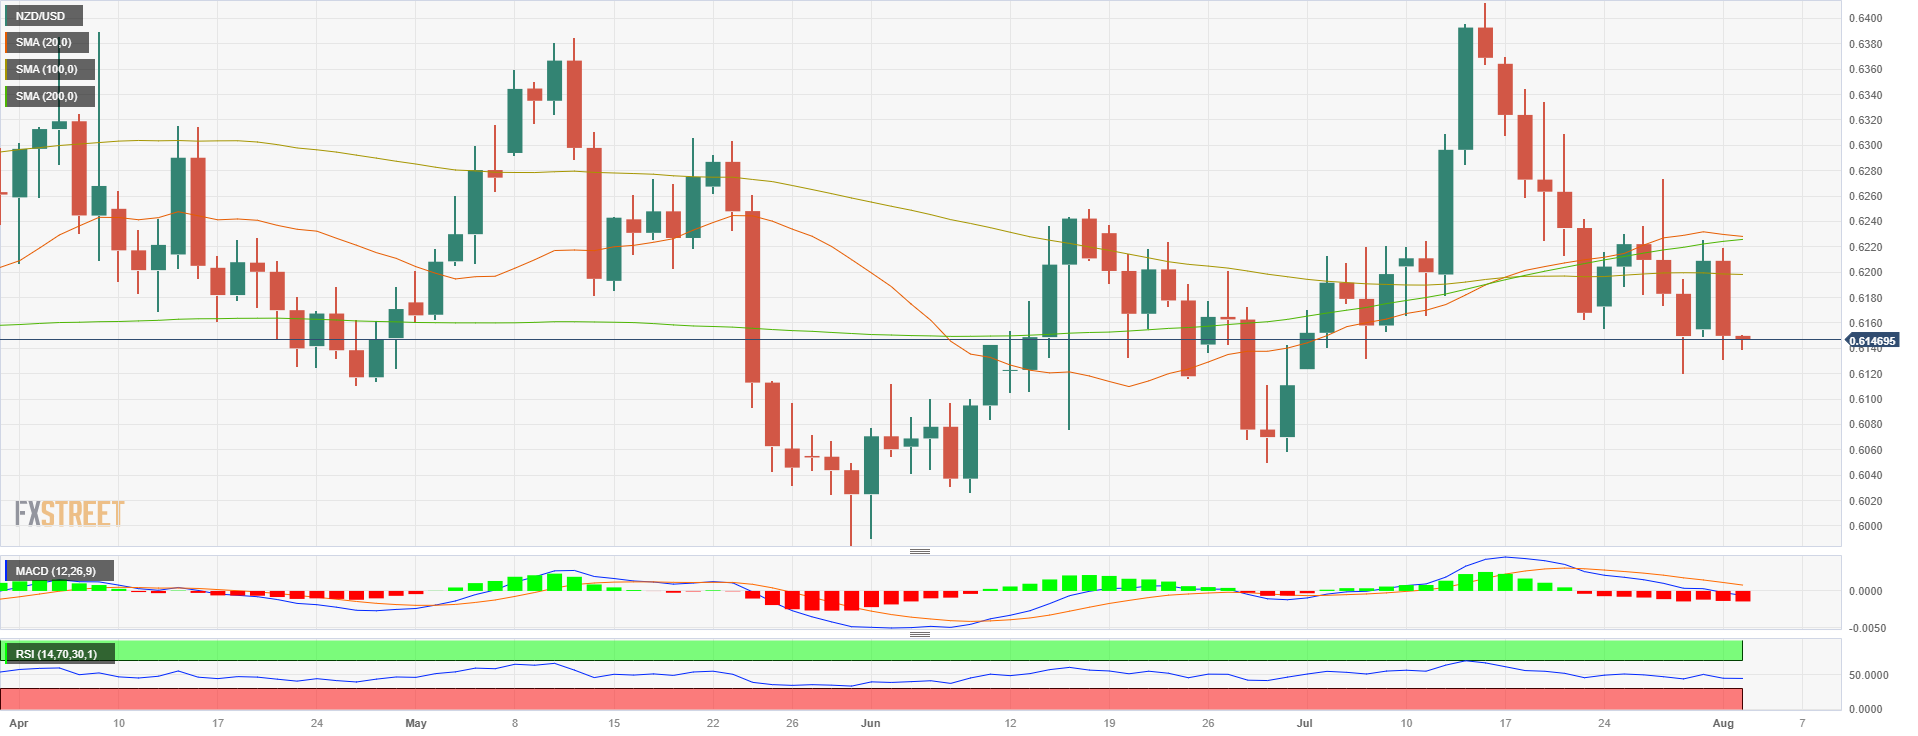
From a technical standpoint, the NZD/USD maintains a bearish outlook for the short term, as observed on the daily chart. The Relative Strength Index (RSI) is comfortably positioned in the negative territory below its midline. Its southward slope is complemented by a negative signal from the Moving Average Convergence Divergence (MACD), which shows red bars, signalling a growing bearish momentum. Additionally, the pair is below the 20,100 and 200-day Simple Moving Averages (SMAs), indicating a challenging position for the buyers in the bigger picture as the bears remain in command.
Support levels: 0.6140, 0.6120, 0.6100.
Resistance levels: 0.6180, 0.6197 (100-day SMA), 0.6222 (200-day SMA).
NZD/USD Daily chart
