NZD/USD Price Analysis: Bears grow stronger, as the pair struggles under the 20-day SMA
- Despite NZD/USD's attempts to recover losses, another rejection at the 20-day SMA sees a retreat to 0.6122.
- The short-term outlook is increasingly bearish, with rising selling traction visible.
- For a break in the bearish outlook, the pair must recover the 20-day SMA at 0.6150.
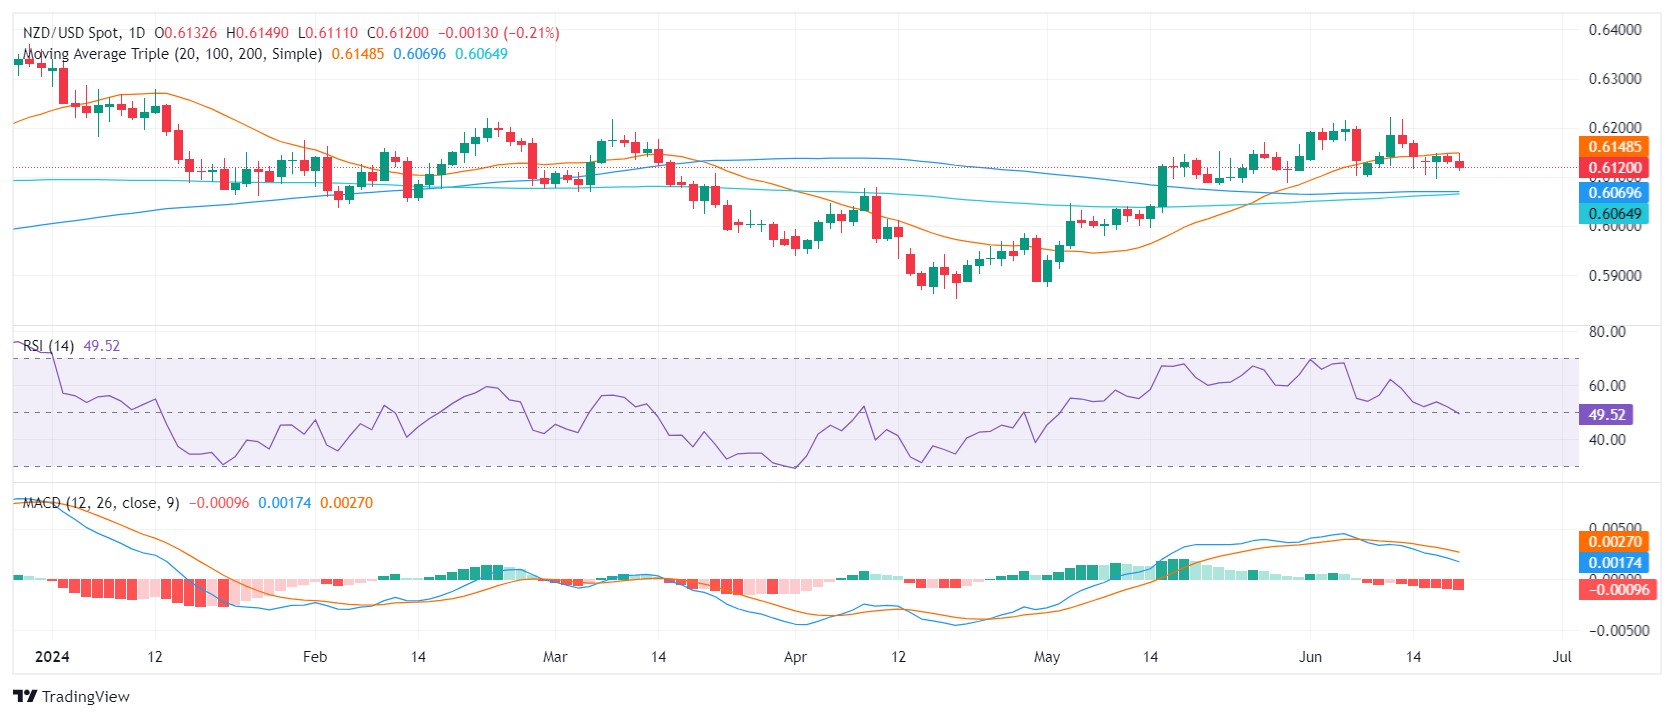
On Thursday, the NZD/USD extended its losses below the 20-day Simple Moving Average (SMA), its fourth consecutive rejection at this strong support level this week. The pair retreated to 0.6122. Despite attempts to recover losses, indicators are signalling rising bearish traction potentially paving the way for further downside unless the pair can regain control over the 20-day SMA around the 0.6150 mark.
The Relative Strength Index (RSI) of the NZDUSD daily chart positions at 49, slightly below the neutral territory. Compared to Tuesday's reading of 51, the RSI indicators are pointing south, suggesting a potential decrease in the market momentum. Despite near-term downward dynamics, it remains distanced from the oversold conditions. The Moving Average Convergence Divergence (MACD) profile continues to print rising red bars indicating an elevated presence of sellers in the market.
NZD/USD daily chart

For the NZD/USD, immediate support remains near the 0.6100 level. Further support is available at the convergence of the 100-day and 200-day SMAs at 0.60695 and 0.60627 respectively. These levels could provide a solid foundation in the event of an extension of the downside move. A break below these SMA convergence points might be indicative of a strong sell-off scenario.
In stark contrast, resistance for the pair is entrenched around the 20-day SMA at 0.6150 level. Then higher up at 0.6170 and finally at the 0.6200 level. A decisive breakout above these levels could potentially signify the end of the current bearish market sentiment and a shift toward bullish dynamics.