NZD/JPY Price Analysis: Kiwi drops but remains near the 97.00 level
- The Kiwi records losses against the Yen but the outlook remains strong.
- Daily chart indicators display resilience, suggesting a potential continuation of the upward trend.
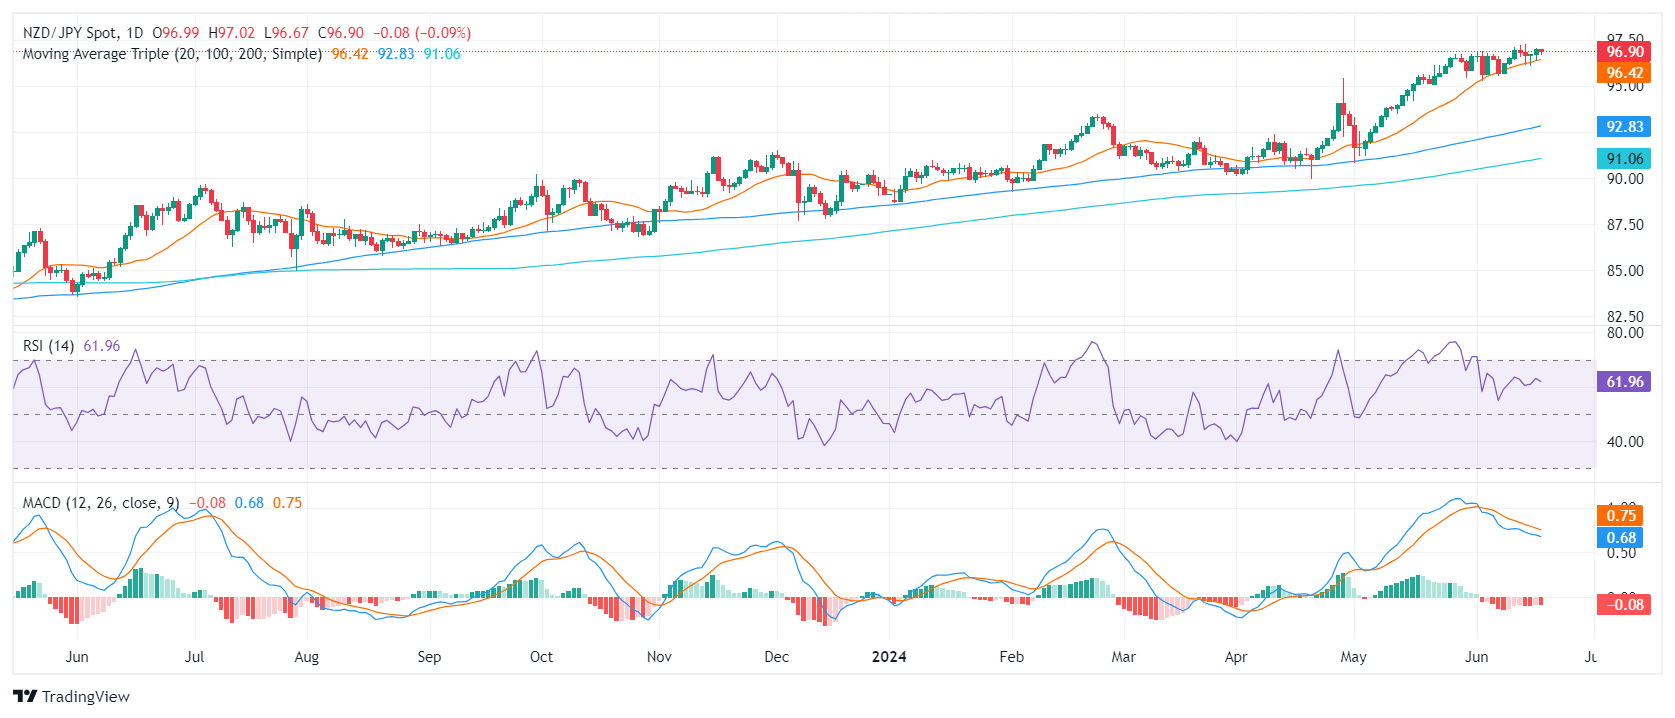
During Wednesday's session, the NZD/JPY pair experienced a mild setback, dropping below the 97.00 point. Nonetheless, the 20-day Simple Moving Average (SMA) at 96.30 demonstrated its resilience once again at the start of the week, effectively staving off the sellers' attempts to breach it.
The daily Relative Strength Index (RSI) for NZD/JPY now registers 61, indicating a decrease from Tuesday's standpoint but still showcasing an overall positive momentum. Conversely, the Moving Average Convergence Divergence (MACD) displays static red bars, suggesting a steady selling pressure.
NZD/JPY daily chart

The buyers, in a show of persistence, continue to maintain their positions above the 20-day Simple Moving Average (SMA), reinforcing the bullish trend's sustainability. The persistence of the daily technical indicators suggests a determination among market players to bring an end to the consolidation phase and buyers appear to be making a comeback following a short retreat.
Upcoming trading sessions may see the pair navigate between support levels at 96.30 (20-day SMA) and the resistance level at 97.00.